Leverage Analytics to Prove Content’s Value in Impactful Ways
Content's ROI is nearly impossible to track, but that doesn't stop executives from asking for tangible data on its impact. Let's explore some ways you can measure your content's value using Contently's innovative technology.

Content’s ROI is nearly impossible to track, but that doesn’t stop executives from asking for tangible data on its impact. It’s not enough to produce quality content that shows positive engagement and organic traffic growth. Many of your key stakeholders want to see the value of your content down to the dollar.
As a content marketer myself, I felt the collective “Uggggh!” reaction that statement just triggered. And for those that don’t know why it’s so frustrating, let me clue you in. It’s because there is no way to calculate content’s impact in exact monetary terms.
Creating a Unique User Experience
Content is part of the user experience, and it plays a huge role in what marketers have coined “the buyer’s journey.” The problem? While it may seem obvious that everyone’s journeys are different, those individual journeys are also never linear.
Take, for example, your decision to buy a new couch. Maybe you have a brand affinity for a specific retailer, or maybe it’s your first apartment, and you’re shopping for furniture for the first time. Maybe you hated your old couch and want to try a new brand. Everyone has different experiences, so their journeys will be different.

Many times, consumers usually start their research online. What companies offer the size, color, and fabric that I want on my new couch? How are the reviews of the company’s furniture in general? What do people think about individual products? Is leather better than microfiber or cloth, for example? In this B2C example, after some online research, the customer (in this case, me!) will generally visit a store to help make the final decision.
This process may take weeks. It may take months. But one thing is for certain. Most people do not start by searching for “couch,” finding said couch, and clicking purchase. There’s a lot of customer interaction that goes on in between.
So, is all hope lost? Not necessarily. Let’s explore some ways you can measure your content’s value using innovative technology.
Utilizing Tools That Showcase Your Content’s Value
Your content team worked hard to develop content that connects your audience to your mission. You want to know how it performed, after all. By measuring content impact using tools built into your content marketing platform (CMP), you can identify the following:
- The total number of readers per piece and their engagement rate (how long they spent reading).
- Where your readership comes from (e.g., organic search, direct visitors, social media platforms, email ads or newsletters, internal visitors, etc.).
- Content value using the Contently Content Value Tracker, which measures the amount of money your brand would have spent on paid Google Ads to get the same amount of organic traffic achieved by each individual piece of content.
- Contributor performance, including total views, engagement, finish rates, and total minutes read for all the content they create.
Content Value Tracker
Contently’s analytics feature provides an innovative solution to measuring your content’s organic traffic, audience engagement, and freelancer productivity. One of the key features of the dashboard is the Content Value Tracker, which allows you to measure the impact of your content on your business goals.
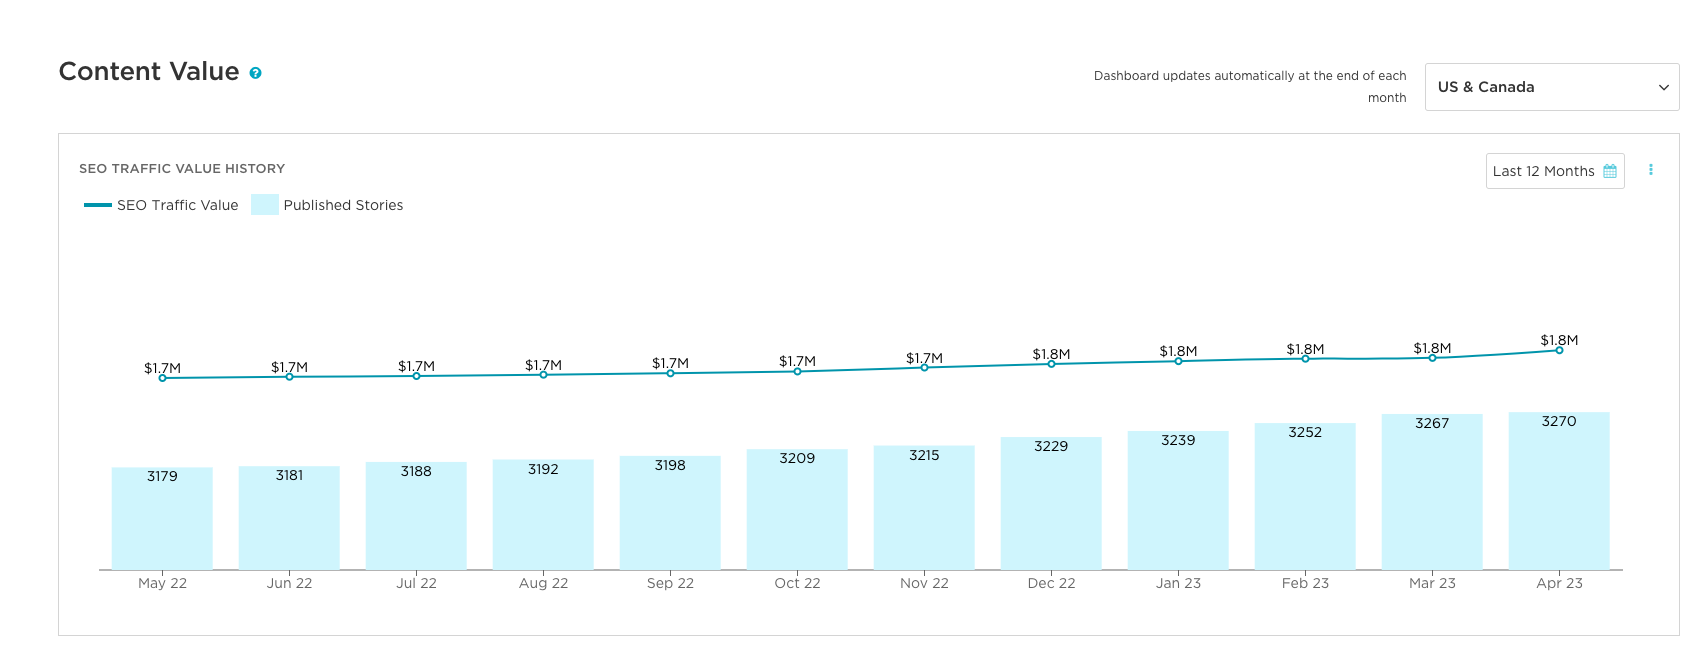
The Content Value Tracker measures the total cost to acquire your organic search traffic and keyword rankings with Google Ads. This proprietary calculation quantifies the value of your organic content production, allowing you to demonstrate the costs saved by creating quality content optimized for organic SERP performance.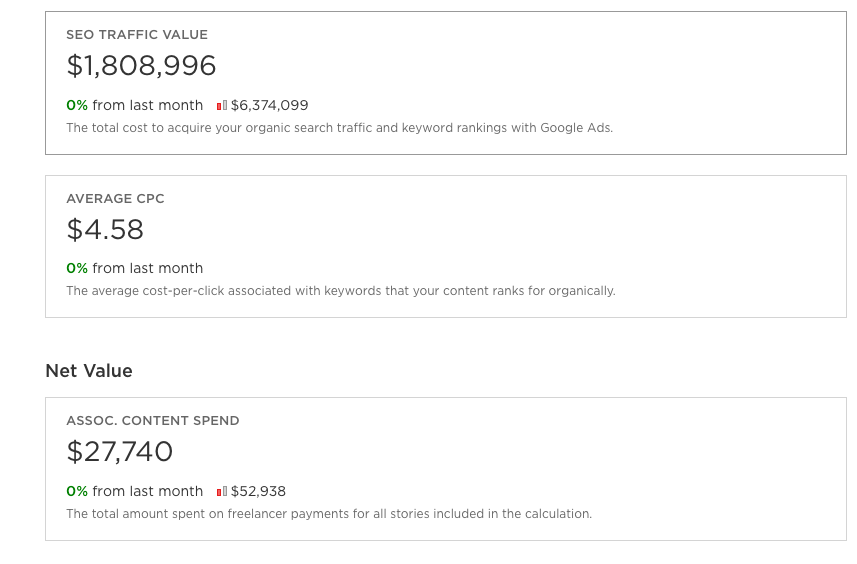
The next time your boss asks you how much your content is worth to the business, you’ll have a monetary value to provide. With the Content Value Tracker, you can:
- Quantify Your Success: Our tool calculates the value of your organic search traffic each month based on the cost you would incur to replicate your success through paid ads.
- Assess Long-Term Value: As your content program grows and you rank for more keywords, the Content Value Tracker captures the increasing value you deliver to your brand over time.
- Boost Your ROI: With these tangible results, you can track the ROI of your content marketing efforts and make data-driven decisions to optimize your content strategy for better performance.
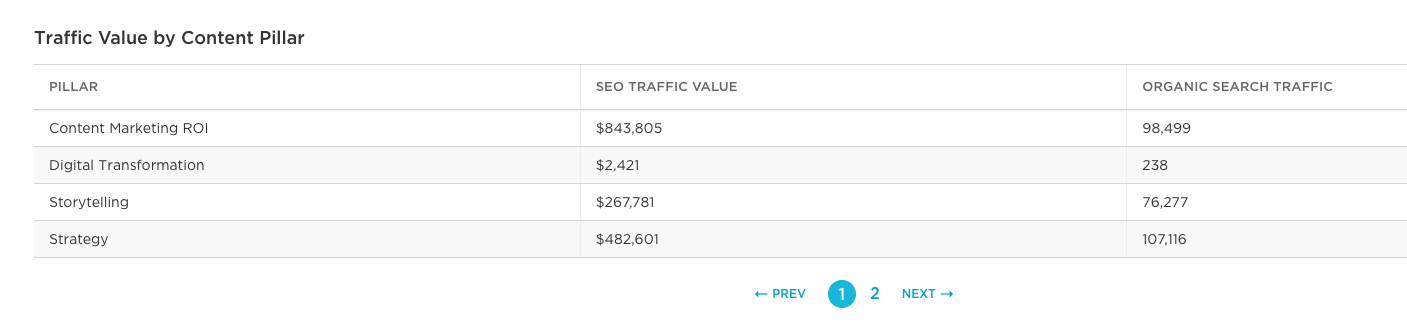
In addition, you can see your content value by topic pillar. Contently’s content strategy enables you to identify the pillar topics that are most important to your brand. In the CVT dashboard, you’ll be able to dial into the measurable impact your content is making by the content pillar.
Contributor Analytics
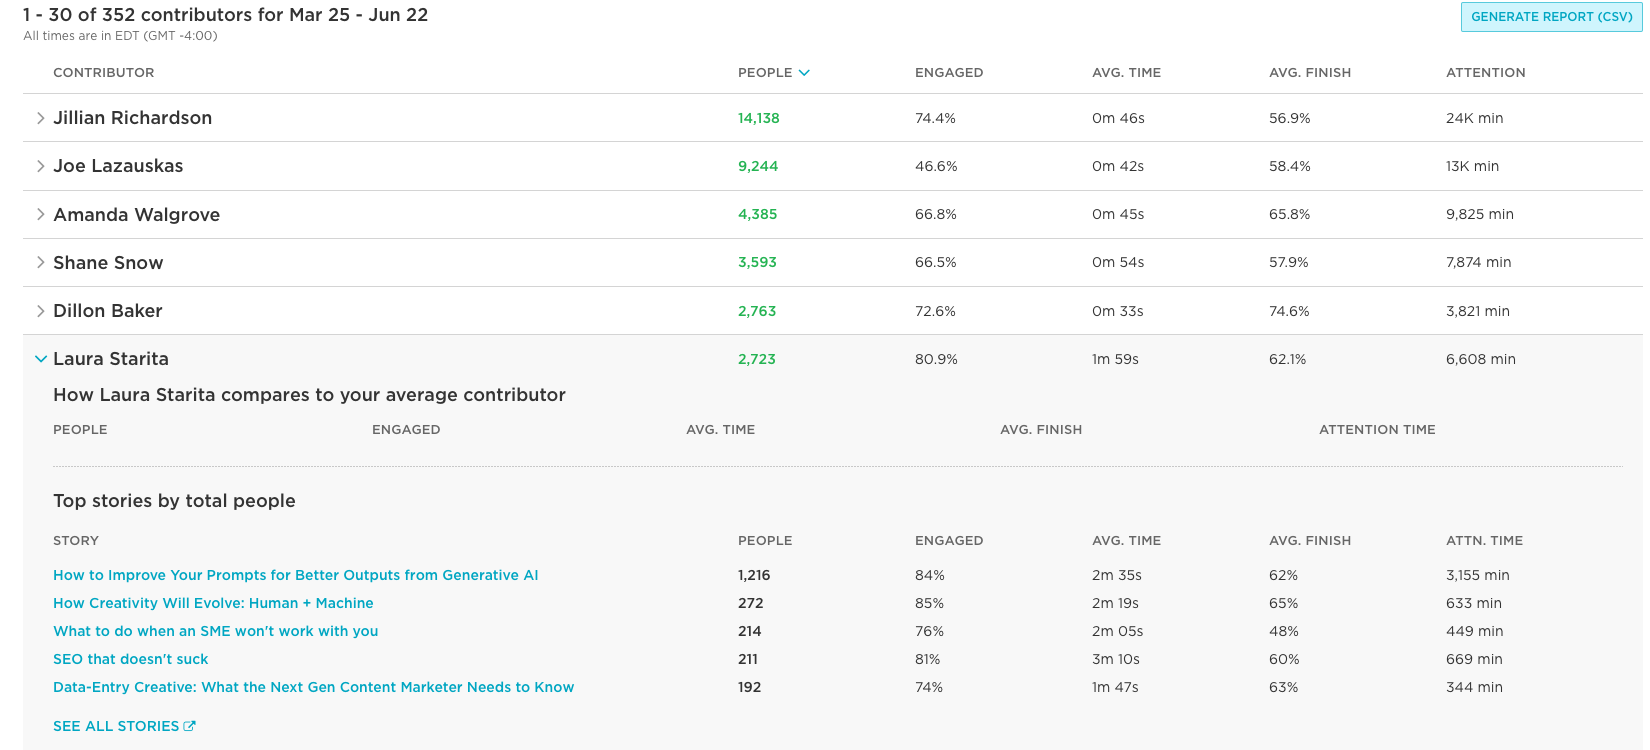
Contently’s analytics don’t stop there. In fact, this comprehensive content marketing platform offers incredible insights into your freelance team’s impact. In Contently’s proprietary Contributor Analytics section, you’ll see a list of all the freelancers you work with alongside a list of metrics for a particular date range.
The example below shows the last 90 days of performance from The Content Strategist’s Creative Marketplace contributors. The metrics include the total number of people viewing this person’s articles, the percentage of those people that engaged with the content, the average time spent on the articles, the percentage of people who finished the articles, and the total attention time given to this freelancer’s content.
When you expand on each individual freelancer, you can see these same metrics broken down by the individual content piece for a more granular view of the freelancer’s impact.
Docalytics
Successful marketing strategies require data-driven decision-making to understand how your audience engages with your content. Traditional metrics provide high-level insights, but long-form content like eBooks, white papers, and presentation slides often become an information black hole, with little to no understanding of how they perform after download.
What if you could go deeper? Imagine understanding exactly how your audience interacts with your marketing content and sales enablement collateral. That’s the power of Contently’s Docalytics.
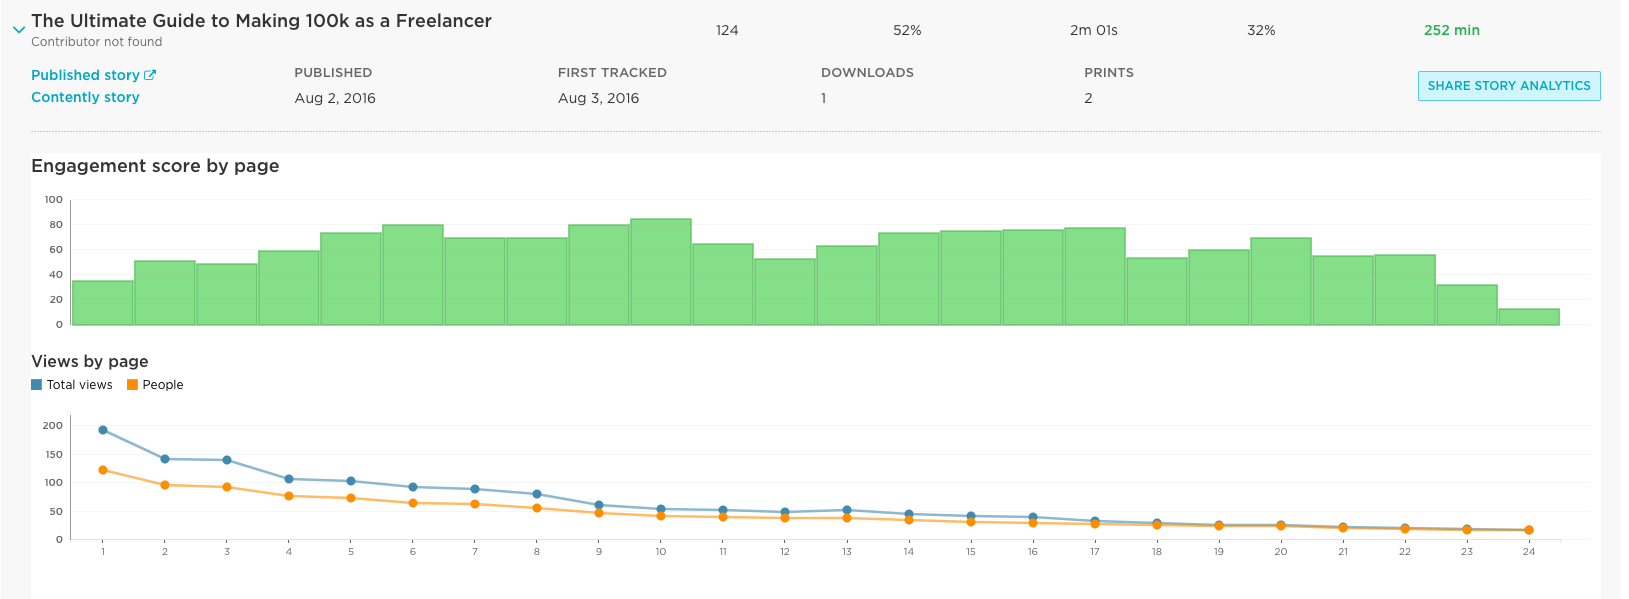
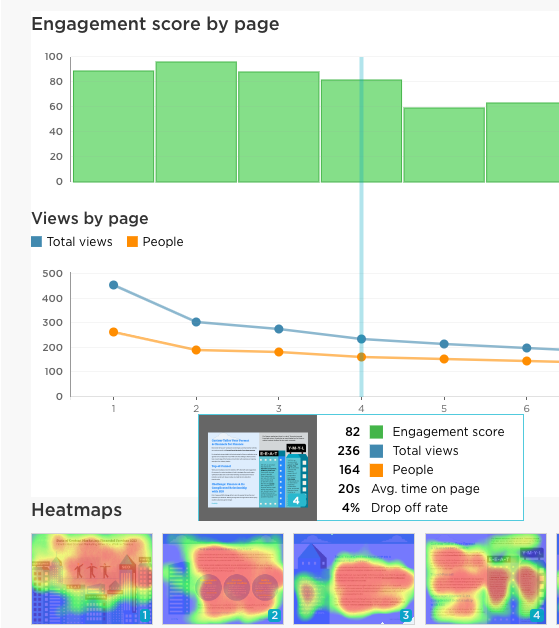
Understand where readers are engaging on PDFs and leverage measurable insights that point to where readers are engaging most. Demystify the metrics around long-form content and create strategic optimization plans based on heat map data.
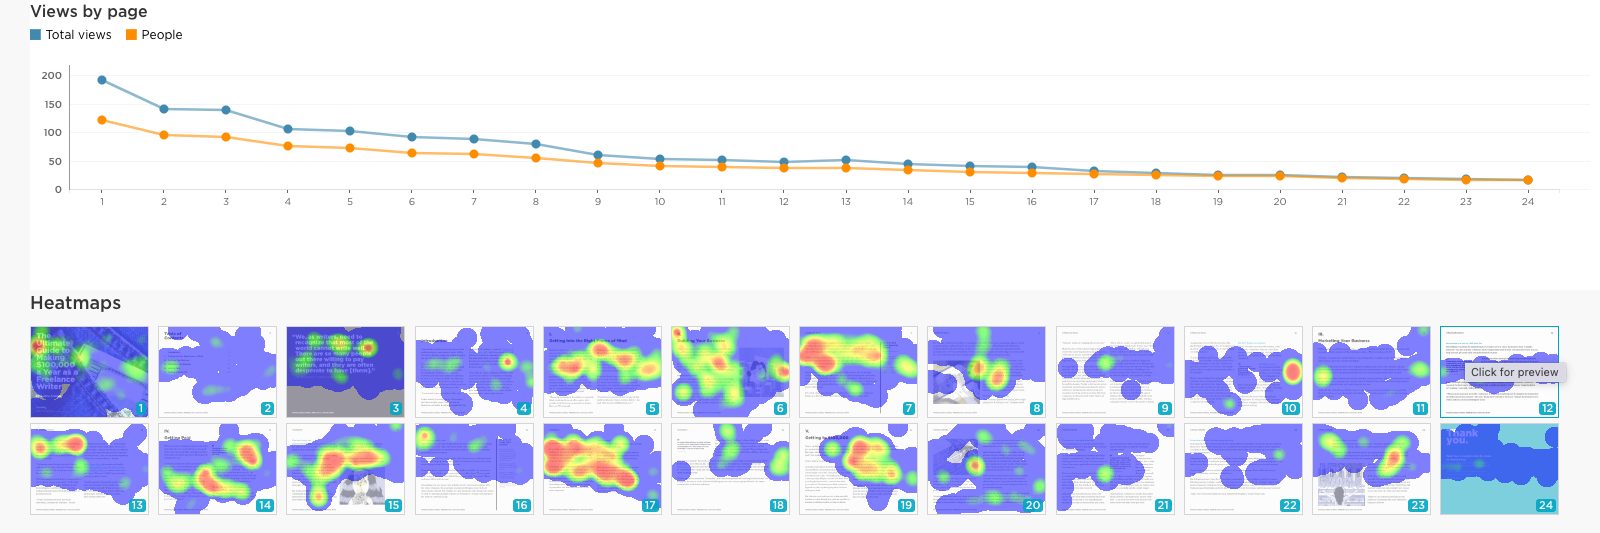
With Contently’s Docalytics, heat maps showcase where readers engage on a PDF, highlighting the most eye-catching content and providing marketers with the data they need to optimize their content for better performance.
Get even more granular with page-by-page analytics for engagement, total views, people, average time on page, and drop-off rate. This in-depth insight helps you understand where your content assets are most effective and where you can improve.
Contently’s comprehensive analytics toolkit enables content marketers to prove the value of their content through budget saved, analyze what topic pillars are performing the best, decipher which big rock content assets are delivering the best results, and how freelance contributors are performing against their peers.
Unlock growth, one piece of content at a time. Transform your strategy with Contently. Request your discovery call today.